LUPMIS
Main menu:
- Home Page
- 1. Background and time frame
- 2. Community Orientation and GIS
- 3. Expected IS activities and output
- 4. Sites of installation and communications
- 5. Data sharing with other LSAs
- 6. Network
- 7. Software
- 8. Human resources and training
- 9. Work activities
- 10. Conclusions and future IS developments
- Annexes
- Annex 1: Projection and datum
- Annex 2: Procurement plan
- Annex 3: Justification of procurement items
- Annex 4: Standards
- Annex 5: Possible scenarios of GIS analyses for land use planning
- Annex 6: DBMS for permits
- Annex 7: GPS mapping
- Annex 8: Data request for GIS
- Annex 9: Financial considerations
- Annex 10: Land use planning activities with IS
- Annex 11: Planning chart: Tasks
- Annex 12: Work programme: Tasks
- Annex 13: Pilot communities
- Annex 14: Coverage of orthophotos for LAP
- Annex 15: Training content
- Annex 16: Glossary
7. Software
7) Software
With the outline of the expected output and activities, the best software to perform the task has to be selected.
7.1) GIS software
In earlier versions of this Report various GIS software programs have been presented and shortly discussed for their pros and cons (see below).
The installation and deployment of an open-source GIS, or freeware or shareware GIS, is very much favored in the Project to avoid extremely high costs, as long as alternative GIS software can deliver the products required for TCPD (as outlined in Chapter 3).
High costs for procurement of off-the-shelf GIS software or development of functionalities in open-source GIS are contradictory to the mandate of sustainability and self-financing for the period after the Project. While the Project might be able to finance the high expenses (see Annex 9), TCPDs District offices, which are financed by District Assemblies on a limited budget, might not be able to do so. The Consultant therefore recommends to look, when selecting the GIS software, into the financial sustainability and to consider the costs of a post-Project era. (See Annex 9 for financial considerations).
The functional requirements of the GIS software are listed according to the output requested:
| Local Plan | Structure Plan | Framework Plan and other overview maps |
|
| Working scale | 2,500 | 10,000-25,000 | 10,000-500,000 |
| Scale range | 1,000-10,000 | 5,000-100,000 | |
| Points | X | X | X |
| Lines | X | X | X |
| Polygons | X | X | X |
| Attributes | X | X | (x) |
| Link to DBMS | (later) | - | - |
| SDE | - | - | |
| Enry | X | X | (x) |
| Overlays | 0-10 | 3-20 | Upto 20 |
| Plotting | X | X | X |
| 3D | (x) | (x) | - |
| Modelling | - | (x) | - |
| Raster overlay | X | (x) | - |
| Georectification of raster | X | (x) | - |
GIS software can from the functionality point of view be grouped in two classes:
- Compilation (including generation and processing) of maps is done primarily by desktop GIS, handled by GIS-literate technical staff, to produce and manipulate maps. Typical examples are ArcGIS or Map Maker (see below). This is a feasible approach to compile data for decision support at land use planning, with different scenarios, what-if analyses etc and a rather limited number of users.
- Dissemination (including retrieval) of maps can also be done by desktop GIS, but particular with a wider audience and many map users often done by customized, database-oriented GIS, often on map servers, in open source code, to enable users to retrieve and view maps or other georeferenced data. An example is PostGIS in line with PostGreSQLs object-related database. These can handle a large number of data and of users in standard data retrieval procedures, as often required by public access on land administration (see also Chapter 1.3).
Following options exist for the selection of GIS software at the LUPMP project:
- ArcGIS
- ArcView
- Spatial Commander
- Quantum
- Map Maker Pro
- XMap
- Grass
- MyWorldGIS
- OpenJump
- OsGeo
- Map Window
- PostGIS
- uDig
- And others
(Because of the different tasks to be performed at the various LSAs, software has not necessarily to be synchronized between all LSAs; see also Annex 4 and Chapter 1.3).
Due to its full functionality of all required tasks expected for LUPMIS execution, its affordability, ease of use and powerful data conversions, Map Maker Pro was chosen as the GIS software of choice.
![]()
In a later stage, if (!) sufficient in-house human GIS resources can be developed, a transition of some GIS functionalities to PostGIS for handling of standardized, routine permit operations can be envisaged.
![]()
Various GIS utilities and add-ons will be used for data conversions, visualization and processing (e.g. BlueMarble Geographic Transformer and Translator; partly already in the Project, partly to be procured).
7.2) Beyond GIS software: Community orientation and dissemination of GIS with new technology
An interesting new technology is the current fast development of Maps API. It enables the dissemination and presence of GIS data on the internet with mash-ups , i.e. merging individual maps from different sources on the internet, making them accessible to a wide audience in a simple way (see also Chapter 10). Google Maps is a well known example of this technology.
![]()
(Technical definition: Web application that combines data from more than one source into a single integrated tool. A typical example is the use of general, cartographic data from Google Maps to add specific, spatial information, thereby creating a new and distinct web service. It is typically sourced from a third party via a public interface or API, hiding this behind a simple unified graphical interface).
Maps API enables an easy way of disseminating information, i.e. proposed and approved land use pattern, spatial units of land use plans, to a broader audience. Users can view dynamic, thematic map or define queries on the internet. At this moment, very few people involved in the decision process of land use planning, have access to the internet, but even these few justify this approach of high transparency, implemented through new technology. It is important to show land use plans to the public, though not necessarily everybody will be able to see them. In future, with wider internet access, public will be more involved and benefiting from this discussion platform.
The Consultant will observe technology trends and develop mash-ups viewing IS and combining it with databases (e.g. permit database), through PHP, CMS and internet-based MySQL database(s).
This is not to be seen as an alternative to the conventional (installed) GIS software, but as an additional tool to disseminate, and to show mapping results to the client audience - the ultimate goal of very GIS activity, in particular of this community based land use planning
For web dissemination an alternative to the above mentioned Maps API technology might be a PHP-based approach accessing the data on PostGreSQL and PostGIS databases (normally strongly recommended for large scales). Further evaluation, testing and decision should be made in the last third of the Project.
7.3) DBMS software
The DBMS (see also Annex 6) has to be based on SQL. Several alternatives exist:
- MS Access
- MS SQL Server
- Oracle
- MySQL
- PostGreSQL
- and more
All these support query, form, report, link functionalities. Also, VB-developed programs can run data entry, processing and retrieval from these databases.
Advantages of MS Access are low cost, large number of users and applications observed in Ghana, and ease of use. It is good for general training and familiarization with relational DBMS. Disadvantages are lower functionality, lower security and difficulties (but not impossibilities) to define interfaces with the GIS. It is recommended to be the initial DBMS to produce first results of LUPMIS (see recommended technical implementation stages in Annex 6).
![]()
MS SQL Server is known and applied in Ghana to a slightly lower degree, with some experiences available. Functionalities are powerful, GIS can be interfaced. It is applied in 1000s of applications worldwide. Due to the resources in Ghana and its functionality sufficient and appropriate for decentralized databases, it is recommended for the permit database at TCPD in the next years.
PostGreSQL is an open-source DBMS, very powerful, available free of charge. It is most likely the strongest of the large DBMS to support GIS.
In a later stage, if (!) sufficient in-house human GIS resources can be developed, a transition of the permit database to PostGreSQL can be envisaged. PostGreSQL is a powerful, economic DBMS engine. It can be downloaded free of charge from the internet, has application to run queries, forms, links etc and a very powerful interface to GIS. As a desktop client GIS, it is supported by PostGIS and also Spatial Commander.
7.4) GIS software for PDA / GPS
For fieldwork and location in the field, a GPS system has to be chosen. The Consultant recommends thorough testing of various GPS system but is highly in favor of a system, which can display orthophotos and other raster maps on-screen (for full discussion, see Annex 7).
If a PDA / GPS combination is selected, the software for tracking and display can be:
- GPS Tuner:, with unorthodox menues, but functional, raster maps (including Google Earth) to be georectified in Map Calibrator
- Tracky
More software is to be evaluated. Other software (MioMap by iGo, SmartMap etc) has been tested, but failed.
7.5) Development of user interfaces for land use planning
As explained earlier (Chapter 1.3) land use planning is very different to land administration. The latter requires access to data in a standardized, modeled way, which should be facilitated through standard retrieval procedures, i.e. menus. Land use planning cant rely on automatic data processing and standard menus to define spatial plans, not even local plans.
It will be assessed, if a user interface will be developed to run GIS models to support land use planning (customization). While these offer the possibilities to be run by staff, which is only marginally trained, they bear the risk of running in a black box: Outputs can sometimes not be understood or even reproduced.
Development of these models also requires some skills, which are not always available.
A thorough assessment of the pros and cons will be carried out at the Project at midterm.
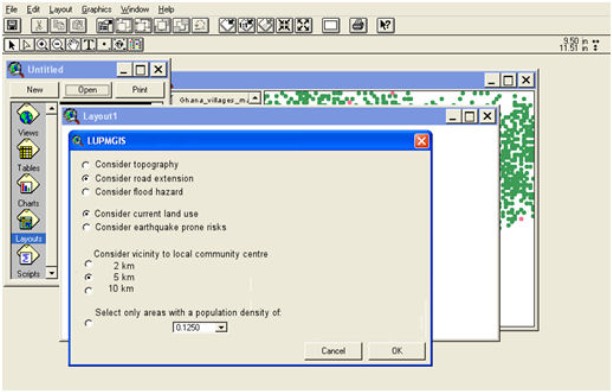
Figure 7.1: Sample for menu driven development of GIS modeling for land use
planning
Copyright @ TCPD / LUPMP - version 2.0