LUPMIS
Main menu:
- Home Page
- 1. Background and time frame
- 2. Community Orientation and GIS
- 3. Expected IS activities and output
- 4. Sites of installation and communications
- 5. Data sharing with other LSAs
- 6. Network
- 7. Software
- 8. Human resources and training
- 9. Work activities
- 10. Conclusions and future IS developments
- Annexes
- Annex 1: Projection and datum
- Annex 2: Procurement plan
- Annex 3: Justification of procurement items
- Annex 4: Standards
- Annex 5: Possible scenarios of GIS analyses for land use planning
- Annex 6: DBMS for permits
- Annex 7: GPS mapping
- Annex 8: Data request for GIS
- Annex 9: Financial considerations
- Annex 10: Land use planning activities with IS
- Annex 11: Planning chart: Tasks
- Annex 12: Work programme: Tasks
- Annex 13: Pilot communities
- Annex 14: Coverage of orthophotos for LAP
- Annex 15: Training content
- Annex 16: Glossary
3. Expected IS activities and output
3) Expected IS Activities and Output
The GIS software has to perform the task, TCPD and LAP are expecting from the IS. No formal user requirement analysis has yet been done, or is expected within near future. The new methodologies developed in the frame of the Project have not yet come to an understanding of all concerned users, what can be expected from the IS. As in many other cases of IS implementation, the new system has first to be installed on-site, in order then to be fine-tuned.
Current and future planned activities of TCPD are the base of the expected output assessment:
3.1) Spatial planning at community level
TCPD has to enhance its capabilities on land use planning. Spatial land use planning includes the identification of areas with their characteristics, their potentials, their needs and their constraints, and the spatial expression of land use pressure. The output is a structure plan, or definition of land use zones, corresponding to the German Flächennutzungsplan.
Planning, from the IS point of view, is the process of combination of input data (current land use, orthophotos, cadastral maps, base maps, economic factors, ecological aspects or maps), combined and filtered according to a set of rules (planning guidelines, policies, law) in an iterative, participatory decision-making progress to come up with new land use pattern (see figure 3.1 below and Annex 10).
![]()
Many of these characteristics can be expressed with their geographical extension, i.e. on maps. (The link to quantitative assessments, such as with socio-economic data, for a combined planning approach, is to be maintained.)
Expected GIS output is not only maps showing the current and future land use at the various stages of the land use planning process, but also maps for use in overlays with simple overlay algorithms (point / line / area buffers, excluding zones, cutters, merge, overlap, combine, join, intersect functions), though not based on numeric formulas. Links to external DB or complex DB relations are not required, unless a land characteristic model with land use requirements is to be performed in a later stage. Therefore, only attribute tables will be used.
Samples of GIS analyses useful for land use planning are shown in Annex 5.
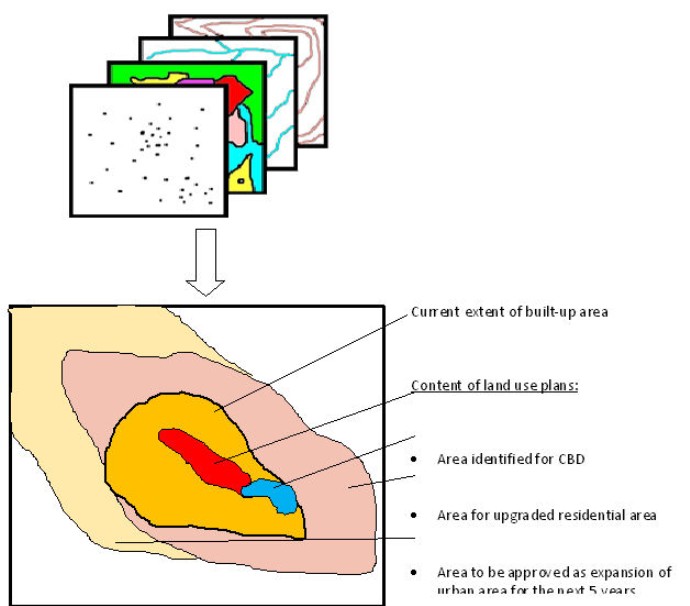
Figure 3.1: Synopsis of input maps to form a map for land use planning,
with different scenarios of land use recommendations
As explained, it is not the software technology or high-level of requested functionality, which is the challenge, but the manpower, which has to be addressed as the priority concern Data communication and access situation are more secondary concern.
3.2) Definition and layout of sector maps
TCPD has to have a system for drawing (tracing) basic line maps with the outline of sector layout, i.e. large-scale maps with parcel lines, individual plots, roads, utilities etc. The output corresponds to a German Bebauungsplan.
![]()
These maps, normally at a scale of 1:2,500, have to be scalable within a certain range (0.4 10 x), a limited overlay will be performed (contour lines, roads, hydro, raster photos, images), but no modeling or 3D are required in the early phases. Spatial extension or statistical functions are required only to the level of calculating areas of individual plots (polygons). Initially, a link to textual data is planned to basic, internally relational attribute tables, but not to an external SQL-based DBMS.
In a later stage, a link will be established to a parcel-based DBMS being set up first within LUPMIS, in later stages to other LSAs through VPN or other web-based protocols.
Main emphasis in this activity is on the ease of use and speed of graphical retrieval of maps (plotting and on-screen), ease of textual retrieval in the later stage, together with ease and error-control of data entry, and an integrated data QC scheme. These are all basic GIS functions. The challenge is the manpower (training of computer-illiterate staff on a very broad basis, some 50-200 staff members), the maintenance of hardware, software and data, and the connectivity (see below)
![]()
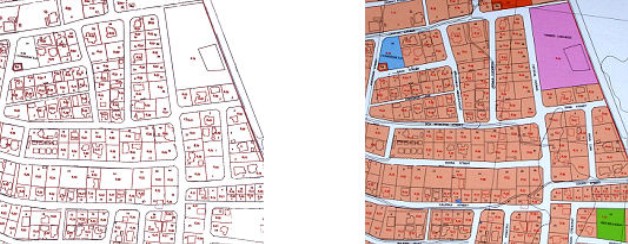
Figure 3.2: Samples of sector layout maps
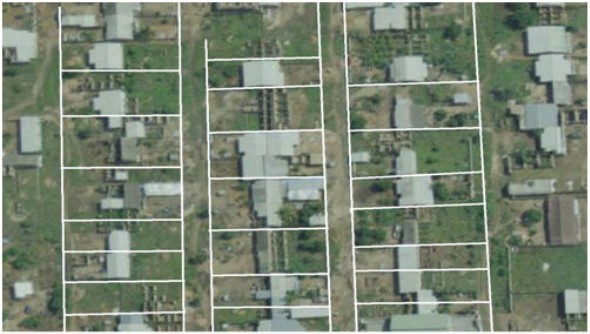
Figure 3.3: Orthophoto (2005) with superimposed parcel units, Kasoa East
3.3) Development and building permits
A third IS output, which has been requested informally, is a textual database to monitor the status of (development and building) permit requests, which is currently one of the main activities of TCPD. This DBMS will include textualgraphical linkages, as mentioned in Chapter 3.1, i.e. linked to the GIS.
The Consultant recommends to develop, install and deploy such a DBMS in all offices of TCPD, where permits are requested. Hardcopy of permits should be stored in the office only for documentary purposes. All processing and issue of permits should be handled electronically.
Conceptual procedures might have to be revised at HQ. They will then define the processes, to be coded (programmed), and tested at beta site. After positive evaluation and successful tests, this system can be installed at all pilot communities, for later dissemination in additional TCPD offices. It will start as a server-based application on the local LAN, later with a backup and mirror server at HQ.
It has to be discussed, if the approach to this Permit Database will be in one phase (directly having the approving system done electronically, with hardcopies only for documentary purposes) or in two phases (first, a tracking system maintaining the conventional hardcopy-based approach, later replaced by the electronic approval system).
In the long term, this will be replaced by the one-stop-shop approach, where all parcel activities will be coordinated through LAP with all concerned LSAs through NLIS.
For a general description of the existing procedures and possible entry menus, see Annex 6.
3.4) Land use monitoring
An additional function of the IS will be the support of land use monitoring, as carried out by TCPD. This will consist of an overlay of the approved land use (planned and approved land use) with newly assessed land use (current land use) to identify areas, where land use has changed either in terms with the approved plan or illegally.
Annex A5.4 contains examples of GIS analyses for land use monitoring (with further reference).
In summary, the output of the IS can graphically be expressed like this:
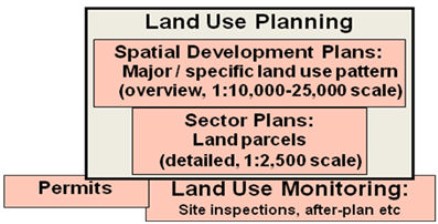
Figure 3.3: TCPD activities with IS support
The activities at TCPD using the IS are shown in Annex 10.
Copyright @ TCPD / LUPMP - version 2.0