LUPMIS - GIS User Manual for Land Use Planning
Main menu:
- Home Page
- 0. Rationale
- 1. GIS handling
- 2. GIS data entry
- 2.1 Create new layer
- 2.2 Digitize line
- 2.3 Digitize point
- 2.4 Digitize polygon
- 2.5 Edit existing layer
- 2.6 Delete feature
- 2.7 Split line
- 2.8 Split polygon
- 2.9 Merge lines from different layers
- 2.10 Unite lines
- 2.11 Snap lines
- 2.12 Join polygons
- 2.13 Extend polygon
- 2.14 Insert island
- 2.15 Define unit surrounding islands
- 2.16 Create 'doughnut'
- 2.17 Fill 'doughnut' polygon
- 2.18 Fill polygon with 'holes'
- 2.19 Digitize parcels from sector layout
- 3. GIS operations
- 3.1 Create buffer
- 3.2 Create exclusion zone
- 3.3 Overlay units
- 3.4 Convert line to polygon
- 3.5 Derive statistics (area size, length)
- 3.6 Clip unit according to other unit
- 3.7 Create geographic grid
- 3.8 Move entire vector map
- 3.9 Move or copy individual features on a map
- 3.10 Adjust polygon to line
- 3.11 Convert points to polygon
- 3.12 Define by distance
- 3.13 Create multiple objects
- 3.14 Transfer styles from one layer to another
- 4. Attribute database
- 4.1 Start with database
- 4.2 Import database
- 4.3 Display database information
- 4.4 Enter attribute data
- 4.5 Attribute matrix of multiple layers
- 4.6 Seeds
- 4.7 Repair attribute data
- 4.8 Merge lines with attached database
- 4.9 Transfer attribute data from points to polygons
- 4.10 Copy styles, labels, attributes
- 5. Conversion of data
- 5.1 Points
- 5.1.1 Import list of points from text file
- 5.1.2 Import list of points from Excel file
- 5.1.3 Convert point coordinates between projections
- 5.1.4 Convert point coordinates from Ghana War Office (feet)
- 5.1.5 Convert point coordinates from Ghana Clark 1880 (feet)
- 5.1.6 Track with GPS
- 5.1.7 Download GPS track from Garmin
- 5.1.8 Download GPS track from PDA
- 5.2 Vector maps
- 5.3 Raster maps
- 5.3.1 Import raster map from external source
- 5.3.2 Quality-check raster file
- 5.3.3 Georeference scanned map
- 5.3.4 Re-georeference image
- 5.3.5 Load sector layout map
- 5.3.6 Shift raster map
- 5.3.7 Download Google Earth image
- 5.3.8 Clipping and masking images
- 5.3.9 Enhance georeferenced image
- 5.3.10 Batch-convert raster images
- 5.4 Communication with other GIS programs
- 5.4.1 Import GIS data from SHP format
- 5.4.2 Import GIS data from E00 format
- 5.4.3 Import GIS data from AutoCAD
- 5.4.4 Export LUPMIS data to other programs
- 5.4.5 Export GIS to AutoCAD
- 5.4.6 Change a shape file to GPX
- 5.4.7 Transfer GIS data to other LUPMIS installations
- 5.4.8 Digitize lines in Google Earth
- 5.5 Terrain data
- 5.1 Points
- 6. Presentation
- 7. GIS for land use planning
- 8. LUPMIS Tools
- 9. Databases
- Annexes
- A1. Map Maker setup
- A2. Background to cartography and raster images
- A3. Glosssary
- A4. Troubleshooting
- A5. Styles
- A6. Classification for land use mapping and planning
- A7. GIS utilities
- A8. Map projection parameters
- A9. Maps in pilot areas
- A10.Standards
- A11. LUPMIS distribution CD
- A12. Garmin GPS
- A13. Training
- A14. ArcView
- A15. Population statistics
- A16. Entry and display of survey data
- A17. External exercises
- A18. Programming
- A19. Paper sizes
- A20. Various IT advices
- A21. Site map and references
4.3.7 Circles with variable sizes (2)
4. Attribute database > 4.3 Display database information
4.3.7 Display of circles with variable sizes (2)
To avoid the vertical line inside the circle and to have easier control over the size of the circles, you can use following alternativ approach:
- 1. You have a column in your source table, which indicates the size of each circle, as shown in the sample table in Chapter 4.3.4 as the rightmost column. You can call this column Size or similar.
You don't need a column 'Dummy'.
- 2. You proceed as explained in Chapter 4.3.4: From the Project manager window: Style (1) > Labels (2) > Option (3) > Data chart (4) >
(If the attribute file (XLS) has not been loaded yet: Choose file window: Select XLS file > Open > Choose link column window: ID > OK) >
> Select data column ('Size' or similar, 5) > Data chart (6) >
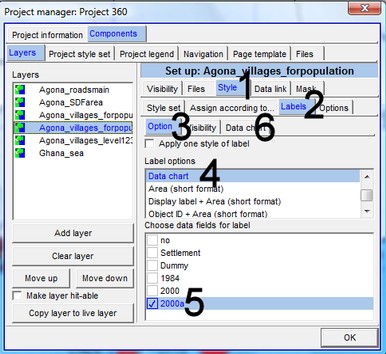
> Single value percentage spot (7) > Size of chart: You can enter any appropriate size (8) > OK (9).

The result can look like:


Sub-Menu:
- 4.3.1 On-hit
- 4.3.2 Figures on map
- 4.3.3 Graded colour scheme
- 4.3.4 Charts
- 4.3.5 Pie charts with variable sizes
- 4.3.6 Circles with variable sizes (1)
- 4.3.7 Circles with variable sizes (2) ←