Information System Concept
for the Land Use Planning and Management Project at TCPD
Chapter 7
Software
With the outline of the expected output and activities, the best software to perform the task has to be selected.
7.1) GIS software
One of the world leaders in GIS is ESRI (Environmental System Research Institute, founded 1969). While it hold an enormous share of worldwide GIS installations in the previous decades, the GIS software company environment has diversified recently very much, due to new GIS companies appearing on the market with very powerful products and in particularly due to the open-source trend, making source code available to developers and application sites free of charge.
The installation and deployment of an open-source GIS, or freeware or shareware GIS, is very much favored in the Project to avoid the extremely high costs of ESRI products, as long as alternative GIS software can deliver the products required for TCPD (outlined in
Chapter 3).
High costs of ESRI software are contradictory to the mandate of sustainability and self-financing for the period after the Project. While the Project might be able to finance the high expenses (see Annex 9), TCPD's District offices, which are financed by District Assemblies on a limited budget, might not be able to do so. The Consultant therefore recommends to look, when selecting the GIS software, into the financial sustainability and to consider the costs of a post-Project era. (See Annex 9 for financial considerations).
The functional requirements of the GIS software are listed according to the output requested:
| |
Sector layout |
Spatial development plans |
Overview maps |
| Working scale |
2,500 |
10,000-20,000 |
10,000-500,000 |
| Scale range |
1,000-20,000 |
5,000-100,000 |
|
| Points |
X |
X |
X |
| Lines |
X |
X |
X |
| Polygons |
X |
X |
X |
| Attributes |
X |
X |
(x) |
| Link to DBMS |
(later) |
- |
- |
| |
|
|
|
| SDE |
- |
- |
|
| Entry |
X |
(x) |
- |
| Overlays |
0-10 |
3-20 |
Upto 20 |
| Plotting |
X |
(x) |
X |
| 3D |
(x) |
(x) |
- |
| Modeling |
- |
(x) |
- |
| Raster overlay |
X |
(x) |
- |
|
Georectification of raster |
X |
(x) |
- |
GIS software can � from the functionality point of view � be grouped in two classes:
-
Compilation (including generation and processing) of maps is done primarily by �desktop GIS�, handled by GIS-literate technical staff, to produce and manipulate maps. Typical examples are ArcGIS or Map Maker (see below).
This is a feasible approach to compile data for decision support at land use planning, with different scenarios, what-if analyses etc and a rather limited number of users.
-
Dissemination (including retrieval) of maps can also be done by desktop GIS, but � particular with a wider audience and many map users � often done by customized, database-oriented GIS, often on map servers, in open source code, to enable users to retrieve and view maps or other georeferenced data. An example is PostGIS in line with PostGreSQL�s object-related database.
These can handle a large number of data and of users in standard data retrieval procedures, as often required by public access on land administration (see also
Chapter 1.3).
Following options exist for the selection of the
GIS software at the LUPMP project:
- If ESRI is to be chosen:
- Full ESRI, with ArcGIS, GIS Server, GIS Engine, for internet, fully licensed, with maintenance,
Pro: Very powerful,
Con: Not sustainable (maintenance contract), expensive, not cost-effective, many features not being used, not simple
- Limited ESRI, with ArcGIS, for internet, fully licensed, no maintenance,
Pro: Powerful, all on same ArcGIS,
Con: Also expensive, not cost-effective, no ESRI maintenance, no central GIS server functionality
- Very limited ESRI, with one ArcGIS / ArcView license per office,
Pro: All functionalities, as forecasted and outlined above,
Con: One workstation not sufficient to perform all work assignment, plus training, plus data entry, plus plotting, necessary to outsource training and part of the work to alternative software
- Based on the arguments before: If ESRI is not to be chosen, but alternative GIS software, with ESRI data compatibility
Pro: Data are compatible with other LSAs, extremely cost-efficient, economic, affordable
Con: Software does not follow current standards at LAP (but data do)
- Spatial Commander, by GDV , open-source, available with MapServer client, has its own MapBuilder software to compile maps; currently, GIS training is carried out with Spatial Commander
Pro: Freeware, with support option (for fee), very much ArcView (ESRI) look-alike, change to ESRI product therefore easy, data fully compatible with ESRI (reads and writes shp files), same approach to GIS handling as ESRI, very good for training
Con: Not same full functionality as ArcGIS, but specific support might overcome limitations
-
Map Maker Pro ('GIS for Africa'): With manuals, GIS server functionalities to be tested; key license has been issued (see
screenshot)
Pro: Free of charge to the Project, very powerful, compatible to ESRI, similar functionalities, very good overlay of raster and vector layers
Con: Different menus to ESRI; more evaluation to be carried out
-
XMap 5.2 : GIS server functionalities to be evaluated, distributed in three versions (Professional, GIS Editor, GIS Enterprise)
Pro: Low cost GIS, but with all basic GIS functionalities,
Con: Not evaluated yet
-
MyWorld GIS / Map Library : GIS viewers
Pro: Freeware, easy to handle,
Con: Not full GIS functionality, primarily for GIS presentations, more basic functions: WordMap, Satellite, RasterStretch, RasterSetup, LineMan, ColumnMap, Africa3D
- OpenJump: Open-source GIS, to be evaluated
Pro: Freeware, highly recommended by other sources
Con: Not evaluated yet
-
OsGeo : Open-source GIS, to be evaluated
Pro: Freeware, recommended by other sources
Con: Not evaluated yet
-
Map Window : Open-source GIS, to be evaluated
Pro: Freeware, easy use
Con: Not evaluated yet
-
PostGIS : Open-source GIS, to be evaluated, runs with PostGreSQL
Pro: Freeware, state-of-art open-source GIS, linked to PostGreSQL
Con: Requires set-up, learning curve
Various GIS utilities and add-ons will be used for data conversions, visualization and processing (e.g. BlueMarble Geographic Transformer and Translator; partly already in the Project, partly to be procured).
7.2) Beyond GIS software: Community orientation and dissemination of GIS with new technology
An interesting new technology is the current fast development of Maps API. It enables the dissemination and presence of GIS data on the internet with
mash-ups, i.e. merging individual maps from different sources on the internet, making them accessible to a wide audience in a simple way (see also
Chapter 10). Google Maps is a well known example of this technology.
Maps API enables an easy way of disseminating information, i.e. proposed and approved land use pattern, spatial units of land use plans, to a broader audience. Users can view dynamic, thematic map or define queries on the internet. At this moment, very few people involved in the decision process of land use planning, have access to the internet, but even these few justify this approach of high transparency, implemented through new technology. It is important to show land use plans to the public, though not necessarily everybody will be able to see them. In future, with wider internet access, public will be more involved and benefiting from this discussion platform.
The Consultant will observe technology trends and develop mash-ups viewing IS and combining it with databases (e.g. permit database), through PHP, CMS and internet-based MySQL database(s).
This is not to be seen as an alternative to the conventional (installed) GIS software, but as an additional tool to disseminate, and to show mapping results to the client audience - the ultimate goal of very GIS activity, in particular of this community based land use planning
For web dissemination an alternative to the above mentioned Maps API technology might be a PHP-based approach accessing the data on PostGreSQL and PostGIS databases (normally strongly recommended for larger scales). Further evaluation, testing and decision should be made in the last third of the Project.
7.3) DBMS software
The DBMS (see also
Annex 6) has to be based on SQL. Several alternatives exist:
- MS Access
- MS SQL Server
- Oracle
- MySQL
- PostGreSQL
- and more
All these support query, form, report, link functionalities. Also, VB-developed programs can run data entry, processing and retrieval from these databases.
Advantages of MS Access are low cost, large number of users and applications observed in Ghana, and ease of use. It is good for general training and familiarization with relational DBMS. Disadvantages are lower functionality, lower security and difficulties (but not impossibilities) to define interfaces with the GIS. It is recommended to be the initial DBMS to produce first results of LUPMIS (see
recommended technical implementation stages in Annex 6).
MS SQL Server is to a slightly lower degree known and applied in Ghana, with some experiences available. Functionalities are powerful, GIS can be interfaced. It is applied in 1000s of applications worldwide. It is good for training and familiarization with SQL (see also
Annex 6).
PostGreSQL is an open-source DBMS, very powerful, available free of charge. It is - most likely - the strongest of the large DBMS to support GIS, with particular support of PostGIS.
The Consultant recommends PostGreSQL in the long term as a powerful and economic DBMS engine. It can be downloaded free of charge from the internet, has application to run queries, forms, links etc and a very powerful interface to GIS. As a desktop client GIS, it is supported by Spatial Commander and other GIS packages.
7.4) GIS software for PDA / GPS
For fieldwork and location in the field, a GPS system has to be chosen. The Consultant recommends thorough testing of various GPS system but is highly in favor of a system, which can display orthophotos and other raster maps on-screen (for full discussion, see Annex 7).
If a PDA / GPS combination is selected, the software for tracking and display can be:
- GPS Tuner: with unorthodox menues, but functional, raster maps (including Google Earth) to be georectified in Map Calibrator
- Tracky
More software is to be evaluated. Other software (MioMap by iGo, SmartMap etc) has been tested, but failed.
7.5) Development of user interfaces for land use planning
As explained earlier (Chapter 1.3) land use planning is very different to land administration. The latter requires access to data in a standardized, 'modeled' way, which should be facilitated through standard retrieval procedures, i.e. menus. Land use planning can't rely on automatic data processing and standard menus to define spatial plans, not even local plans.
It will be assessed, if a user interface will be developed to run GIS models to support land use planning ('customization'). While these offer the possibilities to be run by staff, which is only marginally trained, they bear the risk of running in a 'black box': Outputs can sometimes not be understood or even reproduced.
Development of these models also requires some skills, which are not always available.
A thorough assessment of the pros and cons will be carried out at the Project at midterm.
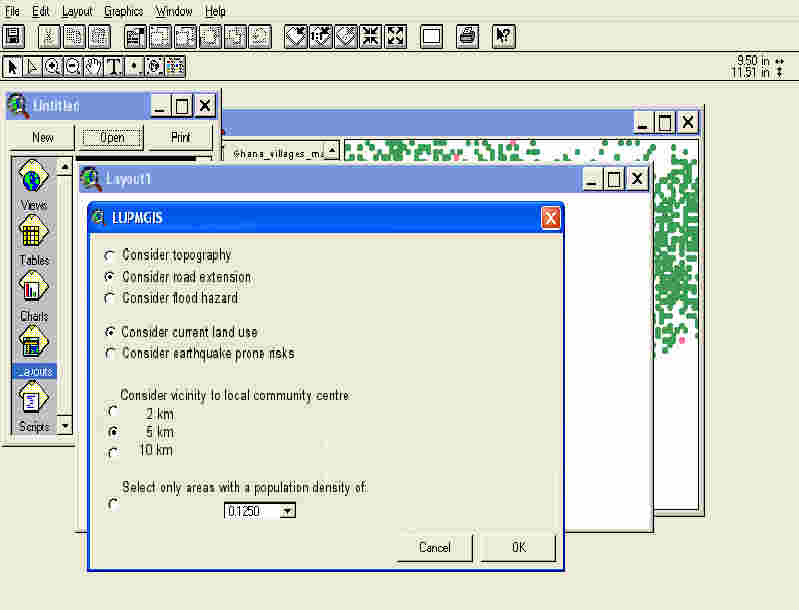
Figure 7.1: Sample for menu driven development of GIS modeling for land use planning
Last update: Dec 2007